Prometheus
Bentocache has a built-in plugin for exposing metrics to Prometheus. To use it, you must first install prom-client and @bentocache/plugin-prometheus:
pnpm i prom-client @bentocache/plugin-prometheus
Then, you can use the plugin like so:
import { BentoCache, bentostore } from 'bentocache'
import { prometheusPlugin } from '@bentocache/plugin-prometheus'

const bento = new BentoCache({
  default: 'multitier',
  plugins: [prometheusPlugin()],
  stores: { myCache: bentostore().useL1Layer(memoryDriver()) },
})
Once you have done this, you must expose the metrics endpoint. Let's say you are using Fastify to serve your application. You can expose the metrics endpoint like so:
import { register } from 'prom-client'

fastify.get('/metrics', async (request, reply) => {
  reply.type(register.contentType).send(await register.metrics())
})
And that's it. You can now view your metrics at /metrics and configure Prometheus to scrape them.
Options
prefix
The prefix to use for all metrics. Defaults to bentocache.
registry
The registry to use for all metrics. Defaults to prom-client's default registry.
keyGroups
An array of [RegExp, ((match: RegExpMatchArray) => string) | string] tuples. The first element of the tuple is a regular expression that will be used to match keys. The second element is either a string or a function that will be used to transform the matched key into a new key. This is useful for grouping keys together. For example, if you have a cache that stores users by their ID ( users:1, users:2 ... ) and you want to register metrics for all users together, you can use this option like so:
prometheusPlugin({
  keyGroups: [
    [/^users:(\d+)$/, 'users:*'],
  ]
})
This may be a good practice if you have a lot of keys, because high cardinality can become a problem with Prometheus.
Exposed metrics
Every metric is prefixed with the prefix option (default: bentocache).
graced_hits
Counter. The number of graced values that were returned from the cache.
| Label | Description |
|---|---|
store | The name of the cache store |
key | The cache key (or grouped key if using keyGroups) |
layer | The cache layer that returned the value (l1 or l2) |
hits
Counter. The number of cache hits.
| Label | Description |
|---|---|
store | The name of the cache store |
key | The cache key (or grouped key if using keyGroups) |
layer | The cache layer that returned the value (l1 or l2) |
misses
Counter. The number of cache misses.
| Label | Description |
|---|---|
store | The name of the cache store |
key | The cache key (or grouped key if using keyGroups) |
writes
Counter. The number of cache writes.
| Label | Description |
|---|---|
store | The name of the cache store |
key | The cache key (or grouped key if using keyGroups) |
deletes
Counter. The number of cache deletes.
| Label | Description |
|---|---|
store | The name of the cache store |
key | The cache key (or grouped key if using keyGroups) |
clears
Counter. The number of cache clears.
| Label | Description |
|---|---|
store | The name of the cache store |
bus_messages_published
Counter. The number of messages published to the bus. No labels.
bus_messages_received
Counter. The number of messages received from the bus. No labels.
Grafana dashboard
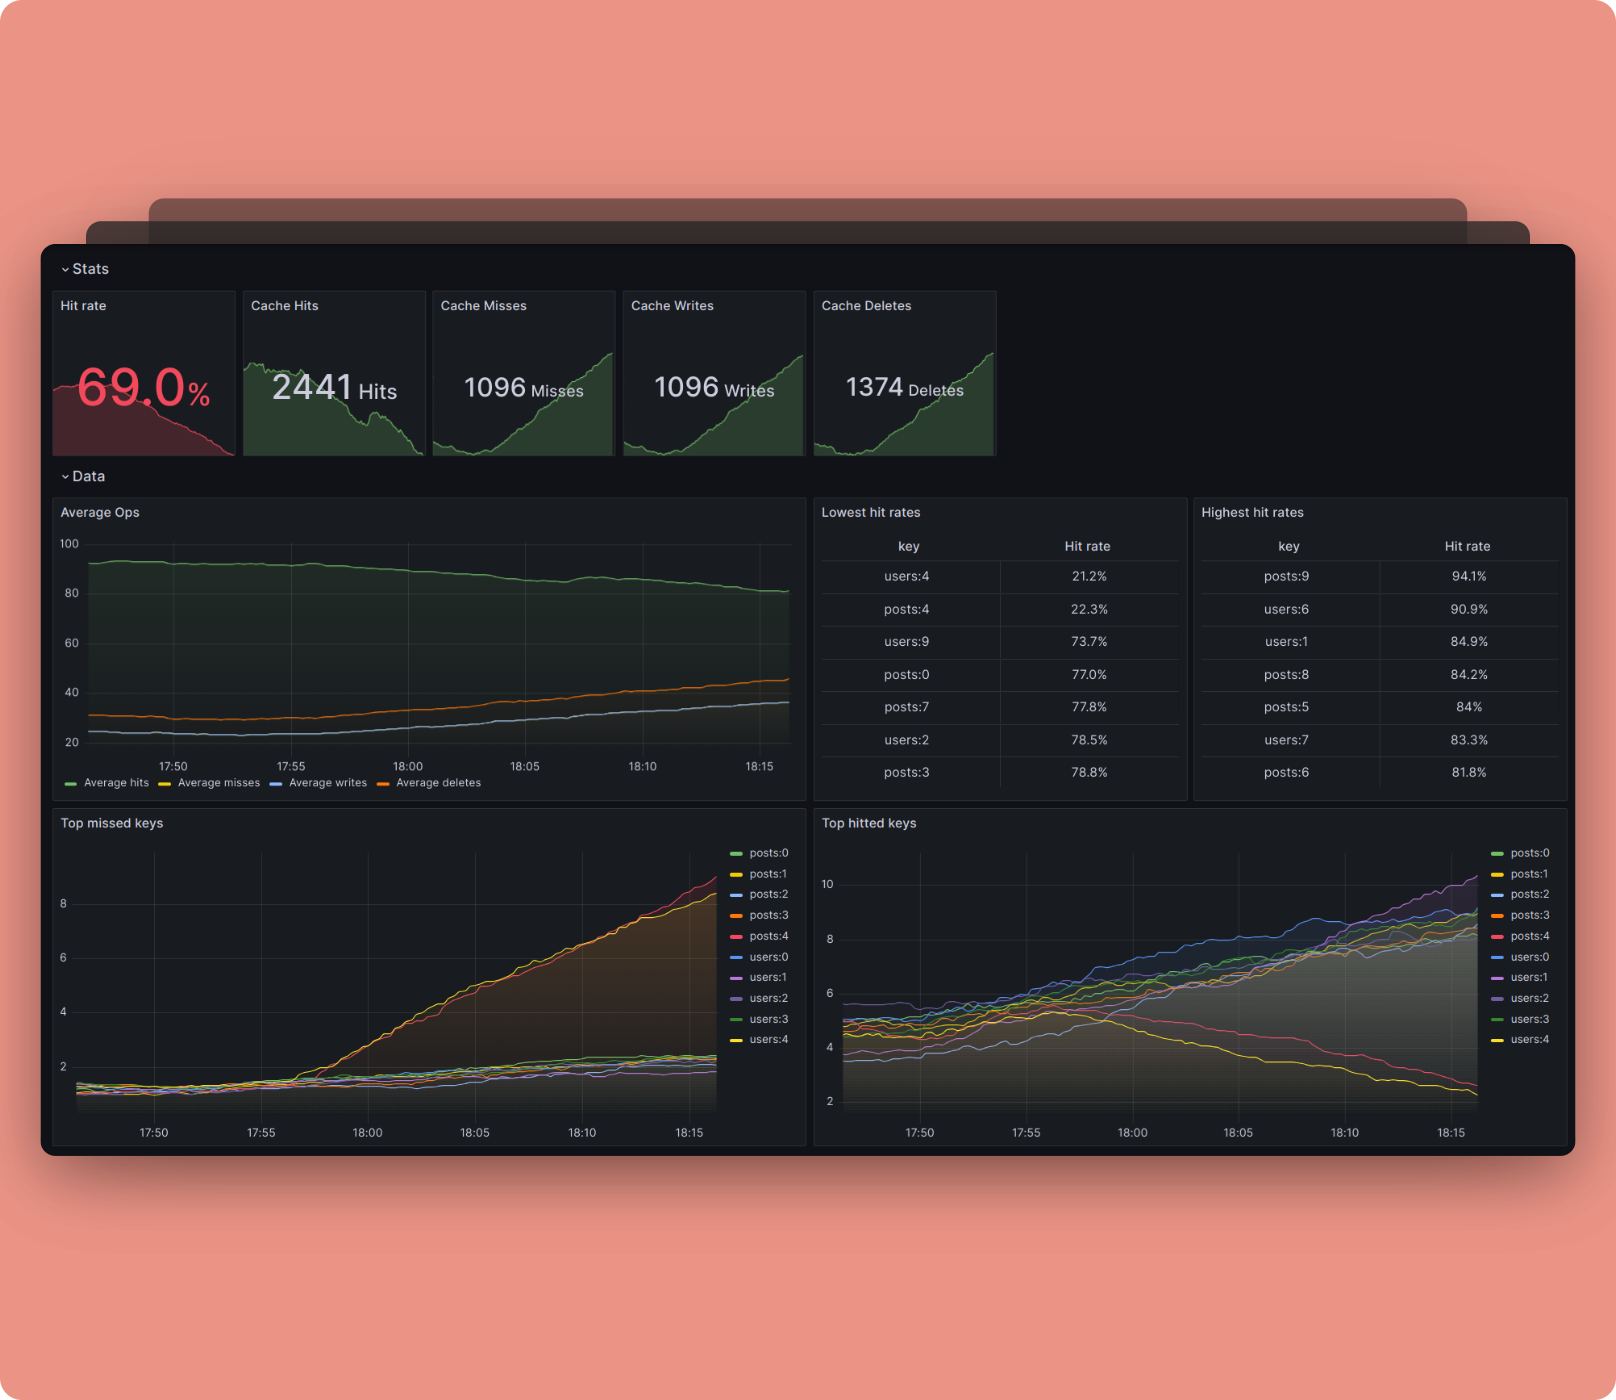
We have a pretty basic but ready-to-use Grafana dashboard for Bentocache. You can find it here.
Happy to accept any PRs that improve it!